
SIP Stoppage Ratio | Investor Secret Conviction Metric

Headline SIP inflows and equity fund numbers swing with market volatility, up one month, down the next. But a quieter metric, the SIP Stoppage Ratio, reveals what investors are actually doing. After two shaky months in early 2026, it's now improved for three straight months, showing retail investors are choosing discipline over panic even through a rocky market.
In This Article
- Introduction
- From Panic to Conviction | SIP Stoppage Ratio 2026 Trend
- Discretionary Cash vs. Systematic Discipline
- Takeaway:
Introduction
If you want to know what Indian investors are really feeling right now, don’t just look at market highs, lows, or total inflows. Look at a metric most people overlook: the SIP Stoppage Ratio. Think of it as a simple tug-of-war every month, between investors who are starting fresh SIPs and investors who are stopping or letting old ones lapse. The SIP Stoppage Ratio just tells you who's winning.
Here is how the ratio is calculated:
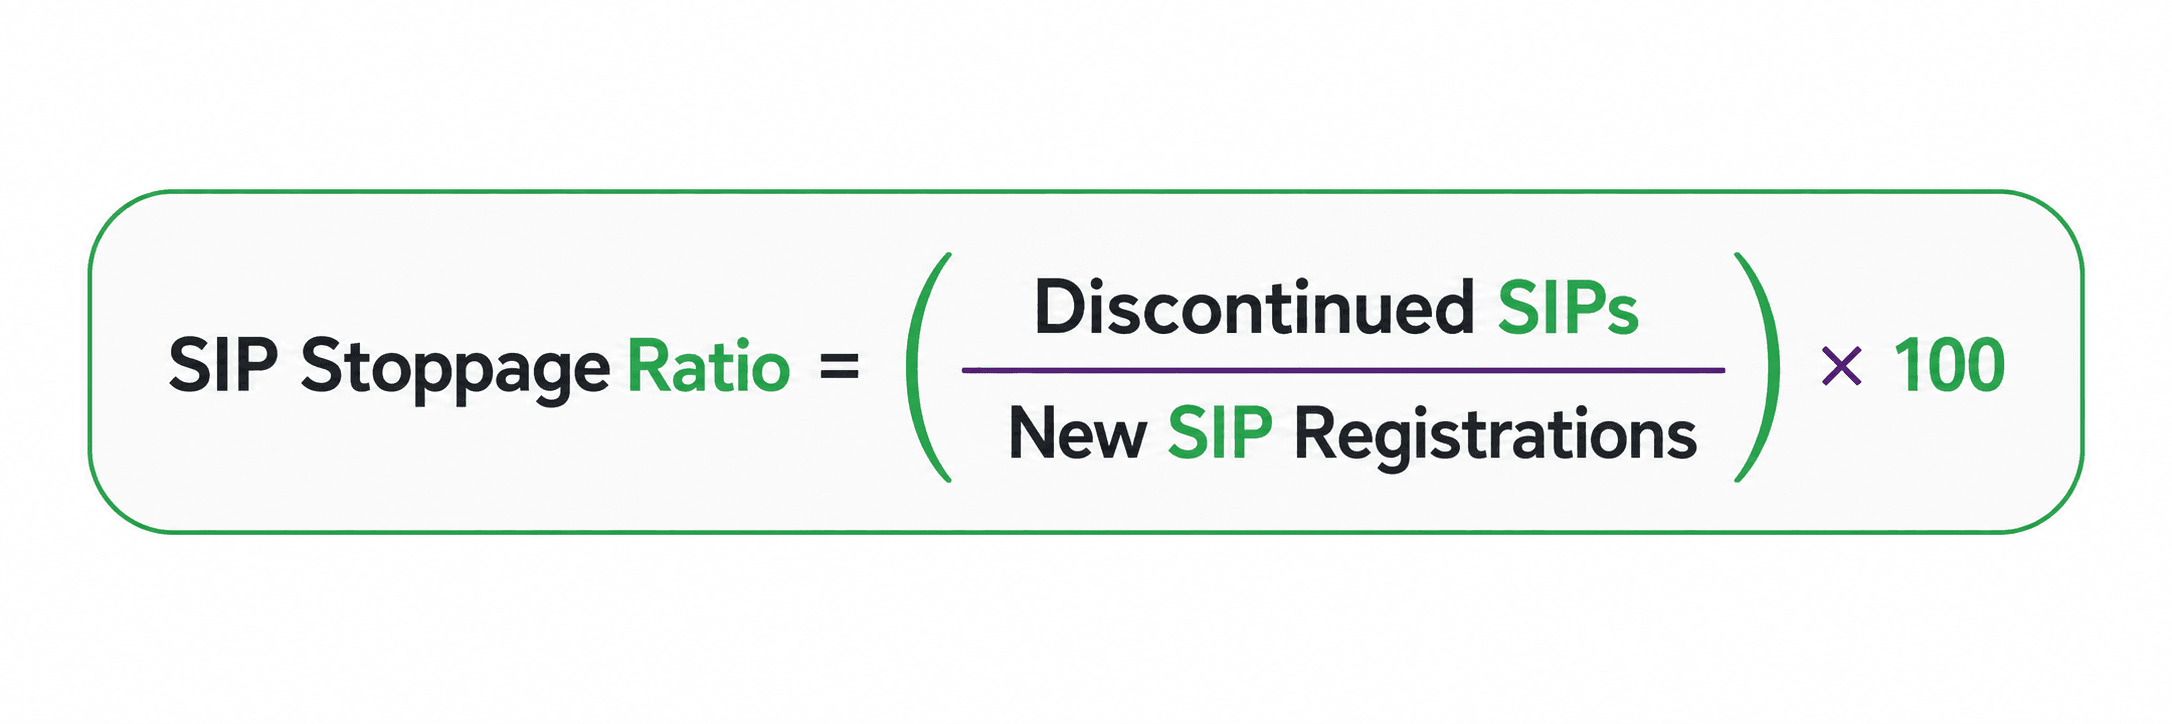
When this ratio goes above 100%, it means more people are canceling or wrapping up their SIPs than starting new ones. That usually happens when volatility sets in and fear takes over. When it falls below 100%, fresh investor commitment is outpacing cold feet.
From Panic to Conviction | SIP Stoppage Ratio 2026 Trend
Earlier in 2026, the signs were concerning. In March and April, the stoppage ratio spiked above 100% for two straight months. This wasn't a reporting glitch, investors were genuinely pulling back amid market swings.
Then the trend flipped:
- May 2026: Dropped to 95.46%, bringing the first net-positive month in a while
- .June 2026: Continued to improve.
- July 2026: Hit 81.9%.
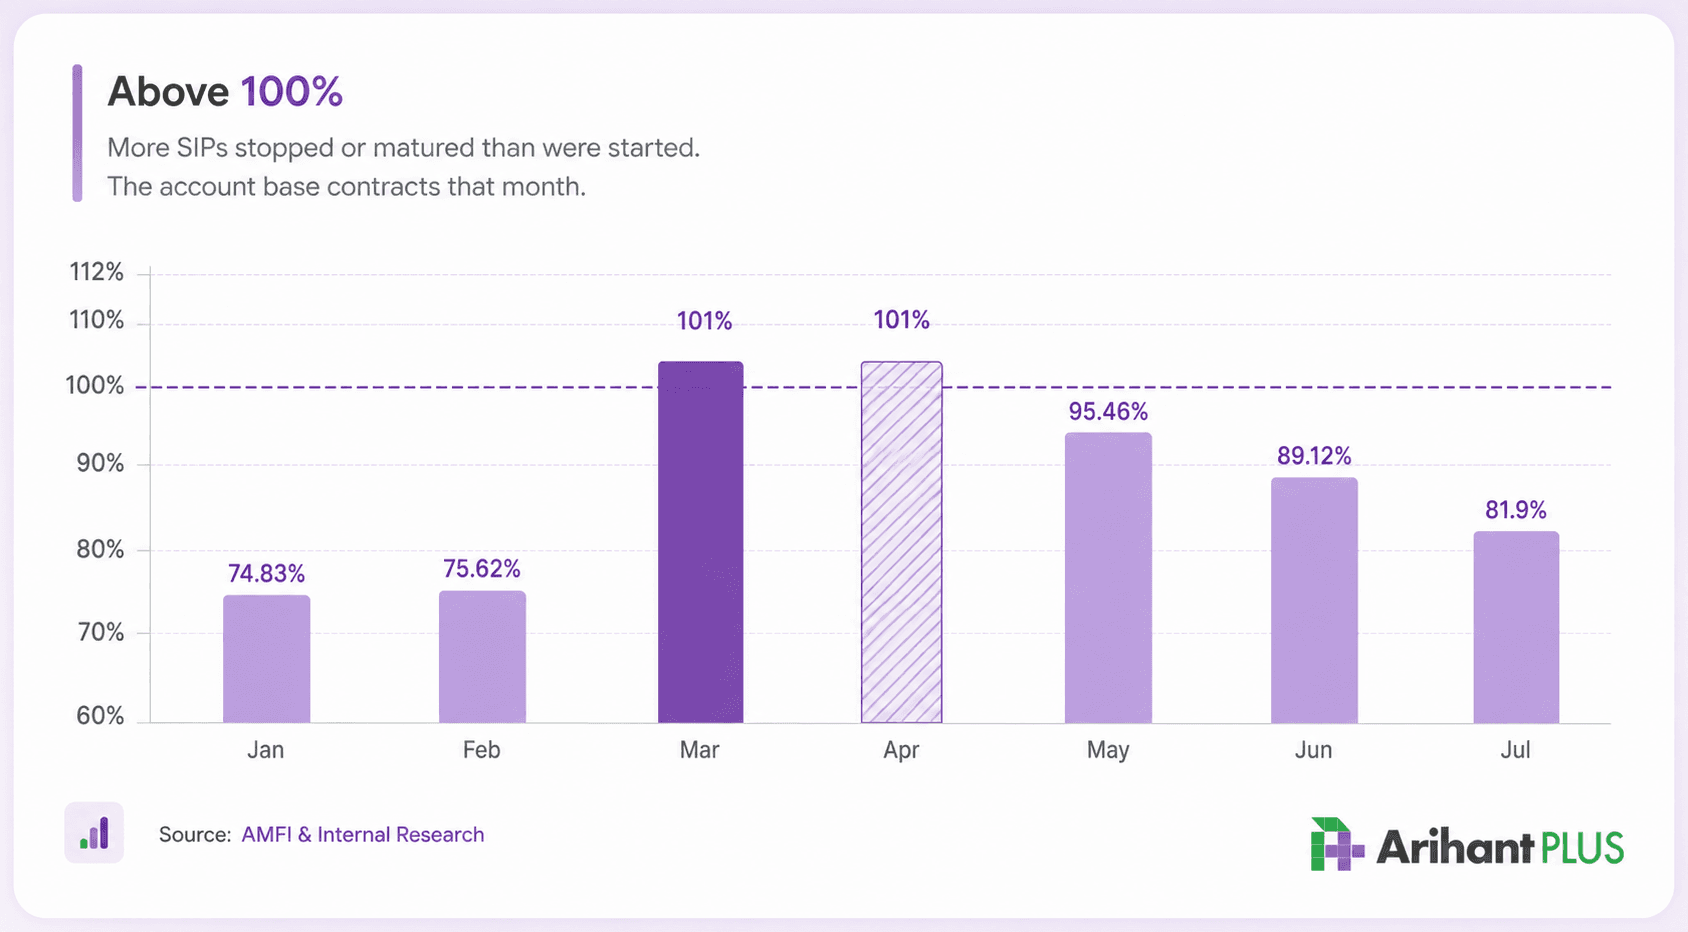
In July alone, investors started roughly 61.4 lakh new SIPs compared to 50.3 lakh discontinuations or maturities. That is a net gain of over 11 lakh accounts in a single month. While 81.9% is still higher than the typical 70% to 90% seen in calm markets, three consecutive months below 100% proves this isn't a fluke.
Discretionary Cash vs. Systematic Discipline
July tested investor nerves. Tensions overseas, rising oil prices, and global headlines caused net equity fund inflows to drop nearly 15% to ₹24,697 crore, with large-cap funds posting their first net outflow in 31 months.
Yet, discretionary money pulled back while the SIP engine kept going:
Monthly SIP Inflow: Reached ₹31,961 crore in July, the fifth month in a row above ₹30,000 crore.
Active Accounts: Expanded to 10.63 crore (up from 8.64 crore last year).
SIP AUM: Crossed ₹18.2 lakh crore, representing over 21% of the entire mutual fund industry's assets.
- High-Value Base: Over 2.3 crore folios now contribute ₹3,000 or more every month.
Takeaway:
SIPs Are Becoming India's Investing Autopilot
Headline inflows bounce around with every news cycle, up 26% one month, down 15% the next. But the stoppage ratio tracks actual investor behavior.
Even through a rocky quarter, retail investors didn't panic-sell or try to time the market. They kept their automated mandates running, trusted rupee cost averaging, and let their long-term plans work.
Data source: All figures and ratios are taken from the latest monthly AMFI (Association of Mutual Funds in India) data for July 2026, released 12 August 2026.

Related Topics

Stock Split vs Bonus Shares: What’s the Difference & What It Means For You?


Stock SIP Explained: A Smarter Way to Build Long-Term Wealth

Mutual Funds vs PMS: What’s the difference and which one is right for you?

Inside REITs: India’s Growing Real Estate Income Opportunity

Small Caps Lead Q1 Growth: Truth Behind India Inc’s Q1FY27 Earnings

Understanding Margin Trading Facility (MTF): A Detailed Guide


What is an Offer for Sale (OFS)? A Complete Guide for Investors

Good-Till-Date Orders: A Smarter Way to Invest Without Constant Monitoring

Ethical Investing Gets Real: NSE and BSE Launch Saatvik and Ahimsa Indices


CM Vijay's ₹213 Crore Bank Balance Teaches India's Biggest Investing Mistake

Understanding Bonus Shares and Their Impact on Your Portfolio

Understanding Stock Splits and Their Impact on Your Portfolio



How to Analyse a Stock in 2026: Fundamental + Technical Checklist






Silver vs gold 2025: Why smart investors are choosing silver now