

Find Trading Opportunities with ArihantPlus Advanced Stock Scanners
By
Arihant Team
ArihantPlus Stock Scanner helps traders quickly identify market opportunities using 55+ technical indicators like RSI, MACD, and moving averages. It filters stocks based on strategy-driven rules, saves analysis time, and supports smarter, more disciplined trading decisions in fast-moving markets.
In This Article
- Introduction
- What Is a Stock Scanner?
- Key Scanners on ArihantPlus
- Advantages of Using a Stock Scanner
- Limitations of Stock Scanner
- How to Use the Stock Scanner on ArihantPlus
- How to Choose the Right Technical Stock Screener
- Interpreting the Results
- Common Mistakes When Using Technical Stock Screeners
- Trader Takeaway
Introduction
In today's market, hundreds of stocks change every minute. Prices go up, down, shoot higher, turn around, and chances to make money can show up and vanish fast. For traders who use technical analysis, going through each chart, using several indicators, and looking for patterns can take a lot of time, and in the markets, time is really important.
That’s where a Stock Scanner becomes your strongest helper!
Open a free account today
Invest in tomorrow with just one click
What Is a Stock Scanner?
A stock scanner is a useful tool that helps you look through many stocks by using set technical rules to find the ones that fit. Instead of looking at each chart one by one, you set your rules and the system picks out the stocks that fit your trading plan.
The Arihant Stock Scanner provides 55 technical indicators to help you find good trading chances more quickly. Once you have a list of stocks, you can look into them more closely before deciding to trade.
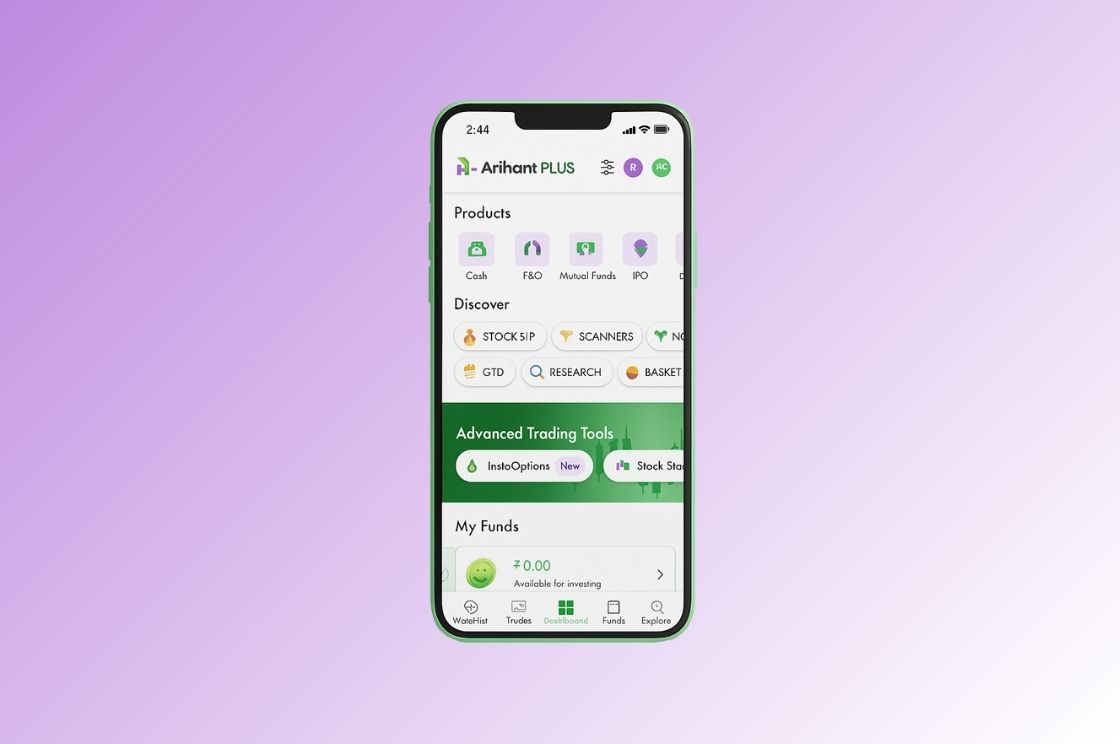
Key Scanners on ArihantPlus
Stock scanners work by using technical filters to analyze the market.
You can choose indicators like RSI, MACD, moving averages, Bollinger Bands, or other options from the list provided. The scanner then checks the chosen universe, such as Nifty 50 or Bank Nifty, and displays the stocks that exactly match those conditions.
Some commonly used indicators that are available in the scanner.
- Moving Averages help identify trends. The Simple Moving Average (SMA) shows the average price over a certain time period, which helps to smooth out the ups and downs that happen in the short term. The Exponential Moving Average (EMA) focuses more on recent prices, so it reacts quicker to changes in the market. Traders usually look for opportunities to enter the market by using moving average crossovers.
- MACD indicator is used to spot shifts in the strength of a trend and determine if the direction of the trend is changing. When the quicker line moves above the slower line, it might show that buying pressure is increasing. A downward crossover may indicate weakness.
- RSI (Relative Strength Index) measures how fast prices are moving. When the RSI goes above 70, the stock might be seen as overbought. When it goes lower than 30, it might be considered oversold. Traders use this to find areas where the price might reverse direction.
- Williams %R works like that too by looking at the current price compared to its recent high and low, which helps spot when prices are too high or too low.
- Parabolic SAR helps identify when a trend is changing direction. When the dots switch places compared to the price, it might show that the direction could be changing.
- Bollinger Bands show how much the price is moving and what range it might stay in. When prices get close to the upper limit, it might show that things are strong; when they are near the lower limit, it could mean things are weak. A sudden increase in the number of band members might also show that there is more uncertainty or risk involved.
These are just a few examples, ArihantPlus has over 55 indicators available for traders to combine multiple parameters and design structured trade setups.
Advantages of Using a Stock Scanner
Technical stock scanners help traders analyze the market in a clear and effective way. Instead of looking through many charts by hand, they let you choose stocks based on set rules like how much the price has moved, how much people are buying and selling, technical signs, and patterns on the charts. This helps make the whole research process quicker and better organized.
- One of the biggest advantages is speed.
Markets change fast, and chances don't wait for anyone. A stock scanner can go through thousands of stocks quickly, which saves you a lot of time that you would normally spend doing it by hand.
- Another major benefit is strategy-based selection.
Instead of making choices based on feelings or random market changes, you follow a set of clear rules when you trade. When you look for particular technical conditions, you're using a clear method that helps you stay focused and do things the same way every time.
Stock scanners also offer customisation and flexibility. There are more than 55 technical indicators to choose from, and you can filter them by specific indices like Nifty 50 and others. This helps you focus on the results that fit your trading plan and market choices.
They also improve opportunity discovery. Sometimes, even good setups can be missed when checking things by hand. A step-by-step filtering process makes sure you don't miss any possible trading opportunities that fit your requirements.
Limitations of Stock Scanner
While technical stock scanners are extremely useful, it’s important to understand their practical limitations.
First, they do not guarantee returns. Scanners are built on technical conditions, which means they rely purely on historical price and volume data. Markets, however, are dynamic. What worked in the past may not always work in the present.
One common issue traders face is false signals, also known as whipsaws. A whipsaw happens when an indicator generates a buy or sell signal, but the price quickly reverses direction instead of continuing the expected move. This is especially common in highly volatile or sideways markets. For example, a moving average crossover may signal a breakout, but the stock may immediately reverse, trapping traders in losing positions.
Since scanners identify stocks based on predefined technical triggers, they cannot always differentiate between a strong, sustainable move and a temporary fluctuation.
Another limitation is that scanners do not automatically account for fundamentals, news events, or sudden developments such as earnings announcements, regulatory changes, or global market shocks. A technically strong setup can fail instantly if unexpected news impacts the stock.
How to Use the Stock Scanner on ArihantPlus
Using the stock scanner on ArihantPlus is simple. Here’s how you can navigate it smoothly:
Step 1: Open the Scanners Section
Log in to ArihantPlus and go to the Scanners section. You can usually find it under the Watchlist or My Account menu.
Step 2: Choose the Scanner Type
Inside the section, you will see different scanner categories designed for various trading strategies such as trend, momentum, or reversal. Select the one that matches your approach.
Step 3: Explore Sub-Categories
Many scanner types include sub-types for more precise filtering. These allow you to narrow your search based on specific technical conditions.
Step 4: Select Your Indicators
Choose the indicators that fit your strategy such as SMA/EMA, MACD, RSI, Bollinger Bands, Parabolic SAR, or others. You can combine indicators to create a more refined setup.
Step 5: Refine the Results
After applying your filters, the scanner will generate a list of matching stocks. You can further sort or refine the results based on your preference.
Step 6: Review the Stocks
Analyse the shortlisted stocks in detail. Study their charts, volume patterns, support and resistance levels, and any relevant fundamental factors before making a decision.
Step 7: Execute and Monitor
If the setup aligns with your strategy, you can proceed with your trade. Continue to monitor the stock and market conditions, and adjust your plan if required.
How to Choose the Right Technical Stock Screener
Choosing the right stock screener depends on your trading style and goals. Here are the key factors to consider:
- Match it with your strategy: Day traders may need real time data and intraday filters, while swing or positional traders may prefer broader trend indicators like RSI, MACD, or moving averages.
- Ease of use: The interface should be simple and quick to navigate so you can apply filters without confusion.
- Range of indicators: Look for a screener that offers multiple technical indicators and allows you to combine them according to your strategy.
- Customisation options: The option to filter stocks by indices (like Nifty 50), price range, or market type helps you focus only on relevant stocks.
- Backtesting feature (if available): This helps you check how your strategy would have worked in the past before using it in live markets.
Interpreting the Results
Once you run a scan, the real work begins. A stock scanner does not tell you what to buy or sell, it highlights stocks that meet certain technical conditions. Your role is to interpret those signals correctly.
Each scanner type serves a different purpose. However, a signal should always be validated. Check the chart structure, volume confirmation, overall market trend, and key support or resistance levels.
Common Mistakes When Using Technical Stock Screeners
While stock screeners are powerful, they can be misused.
- One common mistake is ignoring the broader market context. Economic data, global events, earnings announcements, or sudden news can quickly override technical signals.
- Over-customising filters. Adding too many conditions may narrow results so much that you miss good opportunities. On the other hand, combining too many indicators can also create conflicting signals.
- Don’t skip backtesting and take trades without checking how a strategy performed historically. It is best to judge the trade’s reliability before putting in the real money.
Lastly, relying only on technical indicators without considering overall market trend or company fundamentals can increase risk. Technical setups work best when aligned with broader market conditions.
Trader Takeaway
Live technical stock screeners are dynamic and highly customisable tools that help identify trading opportunities in real time. That said, simplicity often works best. Focusing on clear, well understood indicators and combining them with sound risk management leads to better decision-making.
A stock scanner does not guarantee profits but when used wisely, it improves efficiency, sharpens focus, and helps traders approach the market with discipline and structure.

Related Topics

Introducing ArihantPlus MCP: Use AI Assistants to Analyse, Track & Trade


Introducing smarter, faster & more secure notifications on the Arihant Plus app
New Features Live: ArihantPlus Mobile App just got an upgrade!

