Top Backtesting Mistakes Every Algo Trader Should Avoid
By
Arihant Team
Backtesting assesses a trading strategy’s past performance to gauge profitability and risk. Avoid overfitting with simple rules and out-of-sample testing. Use 5–10 years of clean, adjusted data, include all costs, and validate results by accounting for time zones, holidays, and trading sessions.
In This Article
- Summary
- Introduction
- What is Backtesting in Algo Trading?
- What Are the Most Common Backtesting Mistakes to Avoid?
- Using Too Little Data
- Ignoring Transaction Costs
- Poor Data Quality
- Neglecting Out-of-Sample Testing
- To sum up
- FAQs
Summary
Backtesting evaluates how a trading strategy would perform using historical data, enabling traders to assess its profitability, risk, and overall reliability before execution.
Overfitting makes a strategy fit past data too closely, causing failure in live trading. Use out-of-sample testing and keep rules simple.
Too little data can mislead results. Test across 5–10 years and different market phases for realistic performance.
Ignoring costs like brokerage, taxes, and slippage inflates profits; always include them in your backtest.
Poor-quality data or missing adjustments (splits, dividends) can distort outcomes. Use clean, verified data that matches your strategy’s timeframe.
Skipping out-of-sample testing gives biased results. Split your data into training and testing sets, and adjust for time zones, holidays, and session gaps.
Introduction
According to a research report, the algorithmic trading market in India stood at US$1,051.3 million (₹8,770 crore) in 2024 and is expected to grow at a CAGR of 14.3%, reaching US $2,312.3 million (₹19,250 crore) by 2030. A big part of this growth comes from the rising use of automated execution, faster trading systems, and AI-based strategies that make trading smarter and more efficient.
While algorithmic trading has its own perks, if you are not using proper backtesting trading strategies, you may end up making an unfavourable trade.
Open a free account today
Invest in tomorrow with just one click
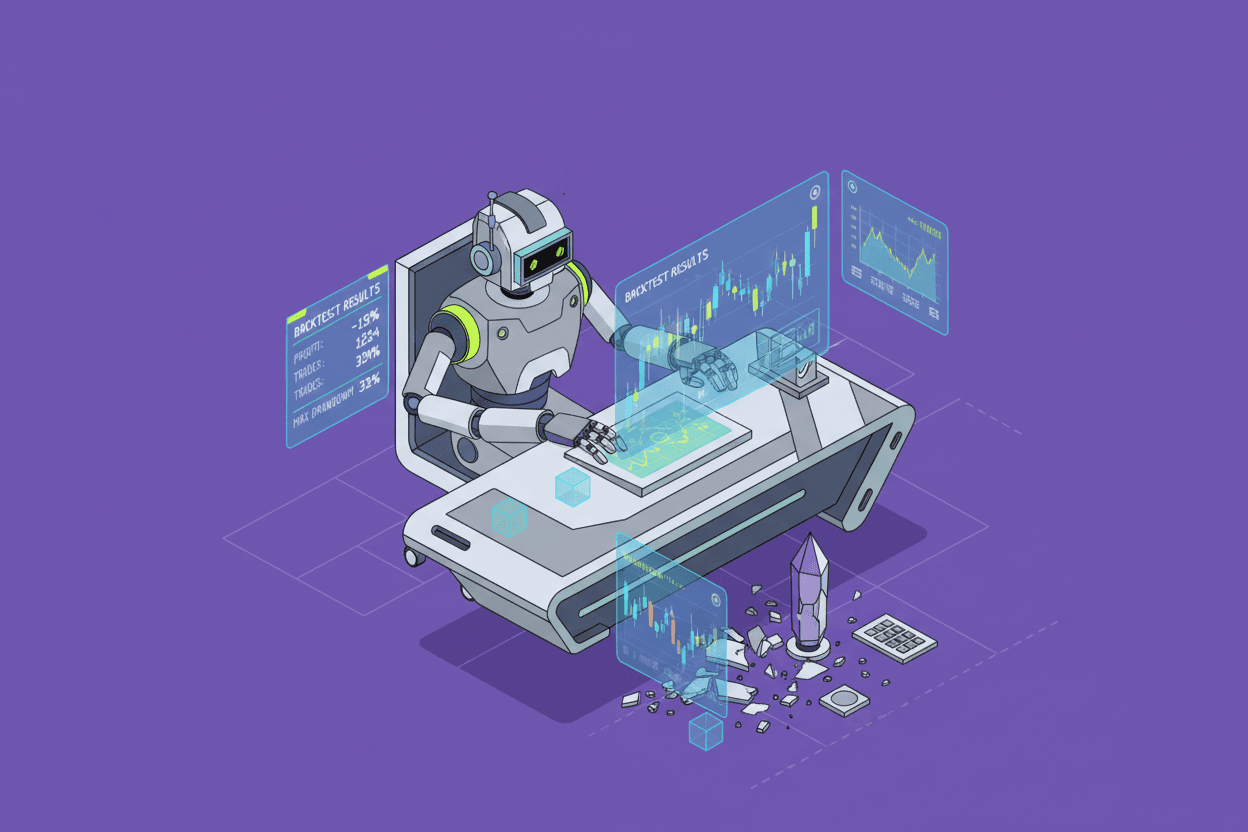
What is Backtesting in Algo Trading?
Backtesting in algorithmic trading means testing a trading strategy on past market data to see how it would have performed. It helps traders analyse profitability, risk, and reliability before applying the strategy in real markets.
Let’s understand this with an example. Assume that you create an algorithmic trading strategy that:
- Buys NIFTY 50 futures contracts when the 50-day moving average of the NIFTY 50 index crosses over the 200-day moving average (known as the golden cross).
- The strategy also includes exit conditions such as a take-profit level, stop-loss, or trailing stop-loss conditions.
This strategy can be backtested on historic price data of the NIFTY 50 to gauge its performance in the past. Suppose this strategy was backtested on historic NIFTY data ranging from 2019 to 2024. You can gain key insights, such as the number of trades taken, the number of winning trades, and the number of losing trades. This allows you to determine the overall performance of the strategy in the past and the returns it has generated.
Backtesting can also be used for options trading strategies. For example, options trading strategies such as straddles or strangles can be backtested to see how they have performed in the past. Backtesting is also helpful for more complex trading strategies that utilise options Greeks.
If the results show steady returns with limited risk, your strategy might be effective. But if it does not perform well, modify your settings and test again before using it in live trading.
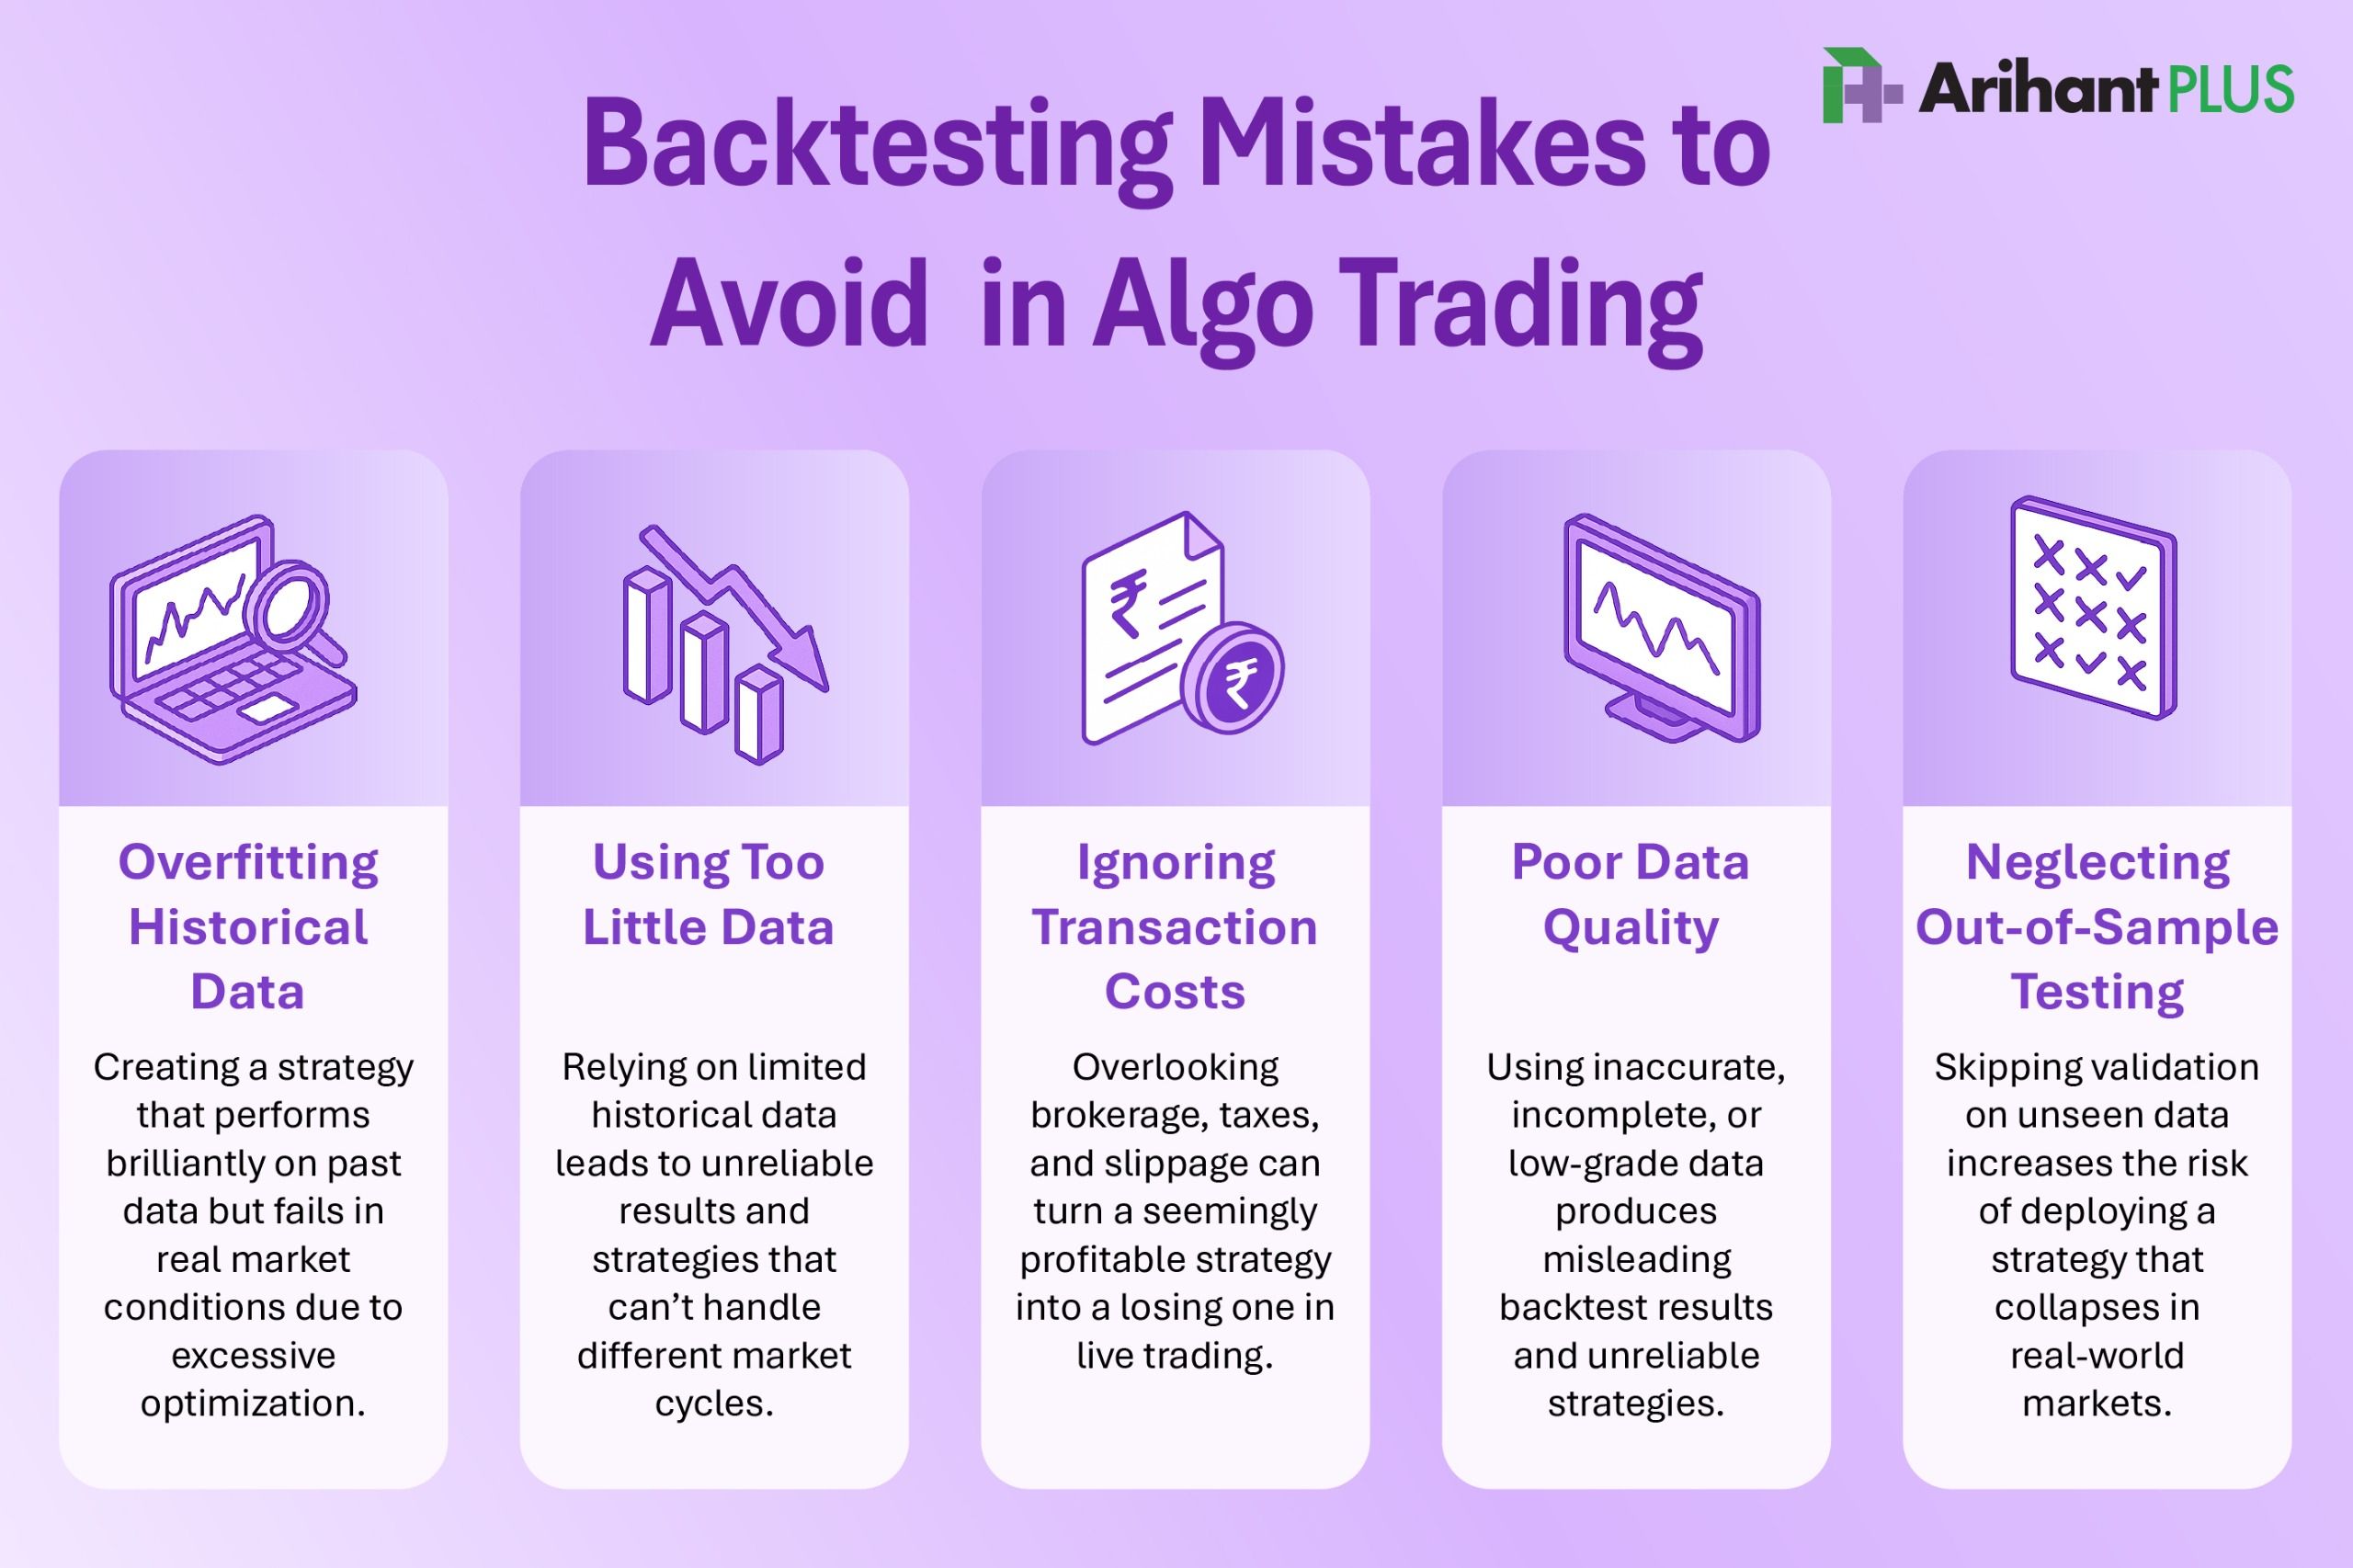
What Are the Most Common Backtesting Mistakes to Avoid?
When opting for backtesting trading strategies, focus on the following parameters:
Overfitting Historical Data
Overfitting means your algorithm is too closely designed to match past market data, including random fluctuations or rare events, rather than general trading patterns.
Suppose you design a moving average crossover system for NIFTY futures. You test dozens of combinations, such as 9/21, 10/30, 11/28, until one gives the highest profit. This ‘perfect’ combination might just match past random movements, not actual market logic.
Solution: Use out-of-sample data to test your strategy. Keep your rules simple and logical. Always ask: Does this rule make trading sense, or does it just make the chart look better?
Using Too Little Data
Using limited historical data for backtesting can give you the wrong picture. Market conditions keep shifting; what works in a bullish phase may not hold up when the market turns volatile or bearish.
Solution: Test your strategy over at least 5–10 years of historical data and across different phases, if available. You should also use multiple instruments, such as indices, commodities, and currencies, to confirm that your logic works broadly.
Ignoring Transaction Costs
Many traders overlook the inclusion of brokerage fees, taxes such as the securities transaction taxes (STT), GST, stamp duty and price slippage in their backtests. Slippage is the small price difference between your expected order price and the actual executed price.
For example, if your backtest shows an average profit of ₹10 per trade. However, if your brokerage and slippage costs together amount to ₹3 per trade, your actual profit drops to ₹7. In thousands of trades, that difference adds up and can turn profit into loss.
Solution: Always include realistic transaction costs for your broker and market type. Add slippage estimates based on market liquidity.
Poor Data Quality
The accuracy of your backtest depends entirely on the data you use. Missing price points, incorrect timestamps, or adjusted data can lead to misleading results. Even small errors can create huge distortions in trading performance. For example, if your data source doesn’t change for stock splits or dividends, your chart might show sudden artificial drops.
Solution: Always check for adjustments such as splits, dividends, and corporate actions. Make sure your data frequency, such as daily, hourly, or minute, matches your strategy’s design.
Neglecting Out-of-Sample Testing
If you use the same data to both build and test your trading strategy, it can give a biased picture of performance. The strategy may appear successful simply because it has been tuned to past data. Time zone mismatches in global data and ignoring trading session gaps, such as overnight or weekend breaks, can also lead to unrealistic results.
Solution: Split your dataset into separate parts for training and testing, and use a walk-forward test to check performance across different time periods. Always align data with the correct market time zone, adjust for holidays and trading hours, and account for overnight risks if your strategy holds positions beyond regular sessions.

To sum up
Successful algo trading begins with accurate backtesting. Avoiding errors like overfitting, poor data quality, and ignoring costs ensures your strategy reflects real-world performance, not illusionary profits.
Reliable testing across diverse conditions builds confidence, minimises surprises, and strengthens your trading discipline to turn algorithmic trading from guesswork into a data-backed, consistent, and sustainable investment approach.
FAQs
How much historical data should be used for backtesting?
Ideally, at least five to ten years of relevant data should be used for backtesting your algos. The dataset must cover different market phases: bullish, bearish, and sideways, to evaluate strategy consistency.
What metrics should be analysed in backtesting?
As a trader, you must review key metrics, including profit factor, Sharpe ratio, maximum drawdown, win rate, and average trade return. These indicators reveal profitability, consistency, and risk exposure.
What is in-sample and out-of-sample testing?
In-sample testing uses data to design and optimise the strategy, while out-of-sample testing checks if it works on unseen data. This helps confirm the strategy’s consistency and ensures it is not just tuned for a specific dataset.
What is walk-forward testing in algorithmic trading?
Walk-forward testing continuously updates and retests a strategy with new market data. It is like checking if your strategy still performs well as time moves forward.
What is a Monte Carlo simulation in backtesting?
Monte Carlo simulation tests how random events like trade sequence changes or price fluctuations affect your strategy. It adds practicality by revealing how outcomes shift during volatile conditions.
Where can the data for backtesting be found?
The data for backtesting can be found on the official websites of the National Stock Exchange (NSE) and BSE. Several charting tools, trading platforms, and brokers also provide access to data which can be used for backtesting.
What are the tools used for backtesting?
Backtesting can be conducted using several platforms such as TradingView. Traders experienced in programming can also write programs which can backtest and provide the results.
What should be the candle duration in backtesting?
The candlestick duration can vary depending on your strategy. While backtesting swing trading or positional strategies, hourly or daily candles can be suitable. For intraday strategies, 5 or 15-minute candles can be more suitable.
Disclaimer: The information, views, and opinions expressed in this article/blog are strictly for educational and informational purposes. Any reference to specific stocks, scripts, companies, or securities is solely to explain market concepts or provide factual context and should not be construed as investment advice, recommendations, or endorsements by Arihant Capital Markets Limited. The blog content does not constitute any form of commercial promotion, endorsement, or partnership with any third-party platform; all such references are included purely for educational purposes. We do not provide guidance on buying, selling, or holding any securities through this content. The inclusion of script names does not imply suitability for any particular investor profile. Investors are advised to exercise their own judgment and seek independent financial advice before making any investment decisions. Securities markets are subject to market risks. Please read all relevant offer documents carefully before investing. Arihant Capital Markets Limited and its employees shall not be responsible for any losses incurred based on the information presented in this article.

Related Topics
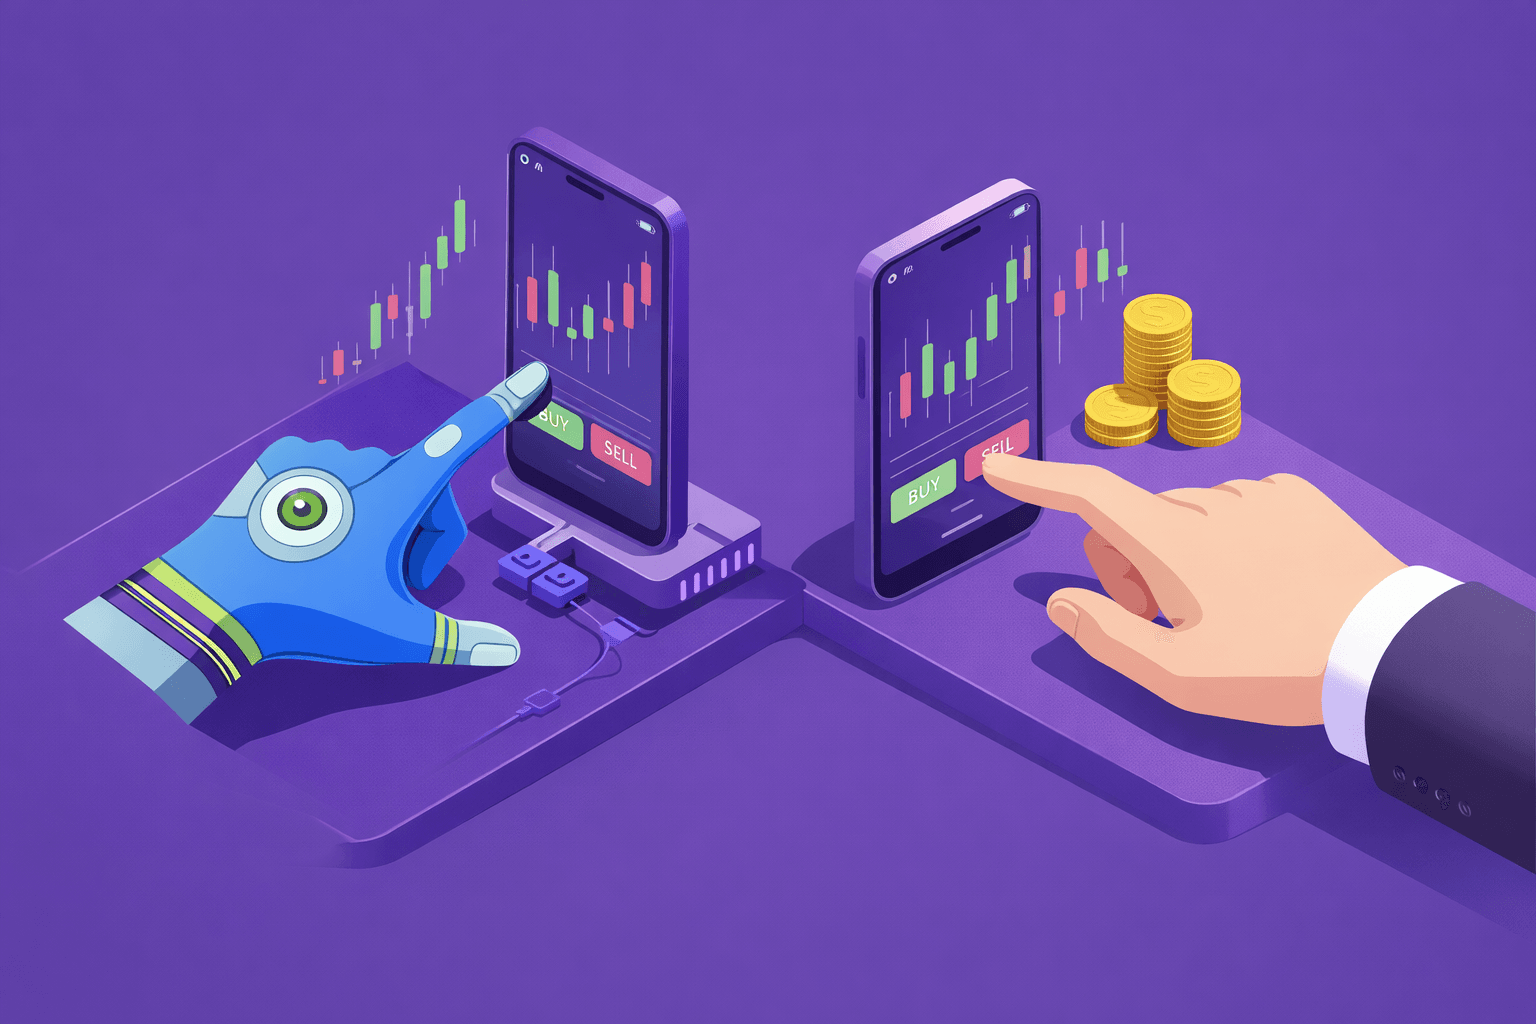
Manual vs Algorithmic Trading: Which One Suits Your Style?
How is Algo Trading Beneficial for F&O Traders? Overview & FAQs

The Rise of Algo Trading Among Retail Investors in the Indian Stock Market