

Option Chain Simplified: Your Key to F&O Trading Success
By
Arihant Team
An option chain is a visual guide for trading options. It shows all available contracts, both puts and calls, for a specific security along with its key data points including option premium, volume, OI, OI change and IV.
In This Article
- Introduction
- What is an Option Chain?
- Decoding Option Chain
- Understanding ITM, ATM, and OTM
- How to Read the Option Chain
- How to Utilize Option Chain Data for Your Trading Strategy
- Conclusion 🎯
Introduction
The option chain is your gateway to options trading. At first glance, an option chain can look daunting - like a whole new language with all those numbers, columns and terms. However, once you understand the basics of an option chain, it can be a valuable tool in making better trading decisions.
You can find real-time option chain on ArihantPlus or other trading platforms and even financial websites.
Wondering what is an option chain and how it works? We’ve got you covered!

What is an Option Chain?
An option chain is a detailed list of all options contracts available for indices like Nifty, Bank Nifty, and select stocks. While not all stocks have options, for those that do, the option chain provides real-time data, offering a snapshot 📸 of the market's current state. An option chain has two sections - calls and puts. A call option gives you the right to buy a stock while a put gives you the right to sell a stock.
Option chains are typically organised in a table format, where the rows list various strike prices, and the columns display different data points (like OI, IV, volume) for each option. The strike price is generally displayed at the center of the table, as it also allows the call and put sections to be segregated properly. The option chain helps traders easily compare options with different features, enabling them to make well-informed decisions. It is an indispensable tool for option traders.
Decoding Option Chain
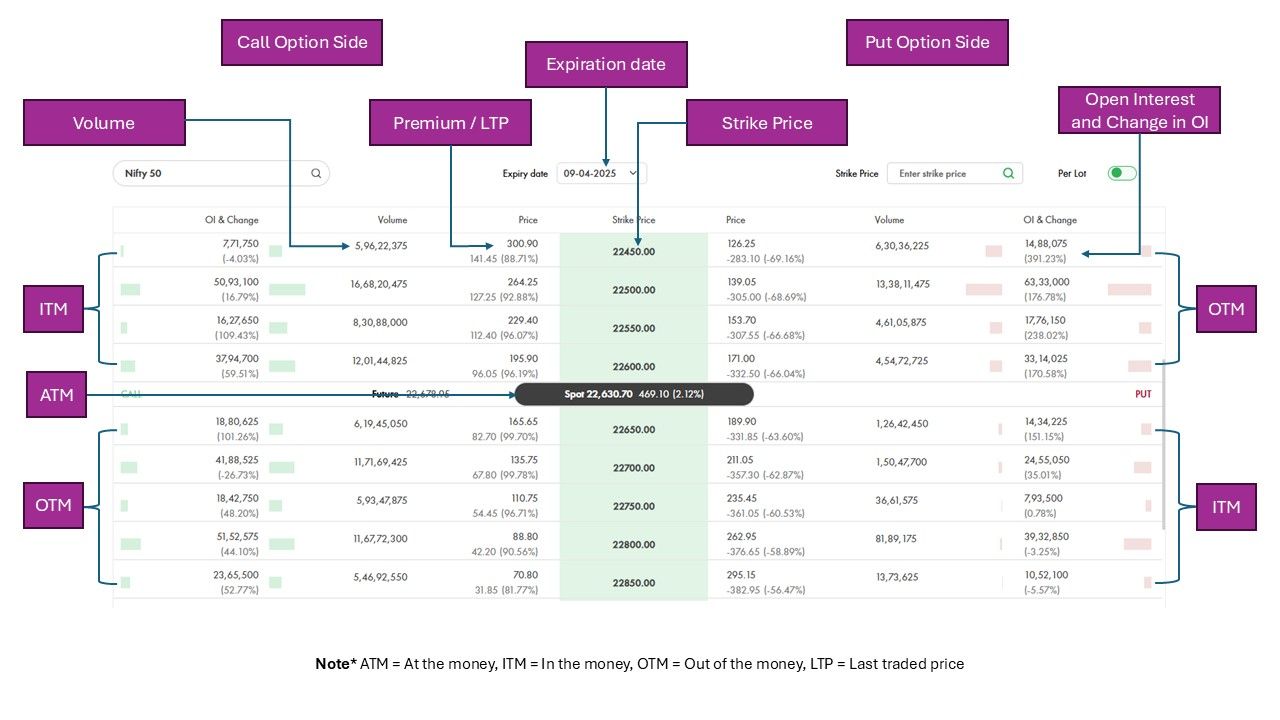 Here’s a breakdown of the most important elements of an option chain:
1. Options Type
Every option chain has two section – calls and puts.
🟢 Call Options: These give the holder the right, but not the obligation, to buy a specific quantity of the underlying security at a predetermined price (strike price) on or before the contract's expiry date.
🔴 Put Options: These give the holder the right, but not the obligation, to sell a specific quantity of the underlying security at a predetermined price (strike price) on or before the contract's expiry date.
2. Strike Price & Premium
The strike price is the price at which you can buy or sell the underlying securities if you decide to exercise your options contract while the price of an options contract is called premium, which is the upfront fee that an option buyer pays to the seller through their broker for purchasing the option.
An options trade becomes profitable depending on the type of option:
For call options, profitability occurs when the underlying asset's market price exceeds the strike price plus the premium paid (break-even point).
For put options, profitability occurs when the underlying asset's market price is below the strike price minus the premium paid (break-even point).
3. Open Interest (OI)
Open Interest indicates the total number of outstanding contracts for a particular strike price. These are basically the number of contracts yet to be closed or exercised.
💡 Tip: High OI = Strong trader interest + High liquidity, making entry/exit easier.
4. Change in OI
This metric shows how the Open Interest has changed over time.
📊 Insight: Significant changes in Open Interest (OI) indicate large-scale position buildup or unwinding, signalling strong buying or selling activity.
5. Volume
Volume represents the total number of options contracts bought and sold for a specific strike price within a given period.
✔️ High volume may confirm trends and indicate strong trader interest, but it should be analyzed with price movement and open interest.
6. Implied Volatility (IV)
Implied volatility is a measure of the market's expectation of future price volatility based on options pricing. Comparing IV across different strikes and expirations can give traders valuable insights into market expectations.
📈 High IV = Expectation of larger price movements in the future.
📉 Low IV = Anticipation of lower price fluctuations or more stability.
7. Last Traded Price (LTP)
The LTP is the most recent price at which the options contract was traded. Changes in the current market price relative to the LTP are shown as “Net Change,” providing a quick snapshot of market movement.
8. Bid and Ask Price
Bid Price: The highest price a buyer is willing to pay for a contract at a specific strike price.
Ask Price: The lowest price a seller is willing to accept for a contract at that specific strike price.
9. Bid and Ask Quantity
Bid Quantity: The total number of contracts buyers are willing to purchase at a specific strike price, reflecting demand.
Ask Quantity: The total number of contracts sellers are willing to sell at a specific strike price, reflecting supply.
10. Expiration date
Some option chains also provide Option Greeks — Delta, Gamma, Theta, and Vega — which are used by traders to measure the factors that influence the price of an options contract. These Greeks help in understanding how various elements like the price of the underlying asset, time decay, and volatility impact the options premium.
11. Option Greeks
Some option chains also provide option Greeks - delta, gamma, theta, and vega, which are used by traders to measure the factors that affect the price of an options contract.
Understanding ITM, ATM, and OTM
In the Money (ITM):
- Call option: Strike price < Current market price.
- Put option: Strike price > Current market price.
At the Money (ATM):
- Option: Strike price ≈ Current market price.
Out of the Money (OTM):
- Call option: Strike price > Current market price.
- Put option: Strike price < Current market price.
💡 Pro Tip: Most trading activity occurs in the ITM window, as it’s more volatile and attracts trader interest.
How to Read the Option Chain
Now that you know the components, let's explore how to read an option chain:
Strike Price and Market Price: Look at the strike prices listed alongside the bid/ask prices. The market price of the underlying asset will determine which options are ITM (In the Money), ATM (At the Money), or OTM (Out of the Money).
Call Option: Strike price < current market price (ITM).
Put Option: Strike price > current market price (ITM).
Volume and Open Interest: Check the volume and OI at different strike prices. A high volume combined with high OI can indicate significant market participation at that strike price.
Implied Volatility (IV): IV is typically displayed for each strike price. Higher IV indicates higher expected volatility, and you may want to adjust your strategy accordingly.
Bid-Ask Spread: A narrow spread means there is a higher level of liquidity for that option, making it easier to enter or exit trades. A wide spread may indicate lower liquidity and higher transaction costs.
How to Utilize Option Chain Data for Your Trading Strategy
Understanding the key data points on the option chain can enhance your decision-making. Here are a few strategies to help you use the option chain effectively:
Trend Confirmation
By analyzing changes in volume, OI, and bid-ask spreads, you can confirm existing market trends. For example, if the market is trending up and there’s high OI at higher strike prices, it may indicate further bullish sentiment.
Volatility Analysis
Implied Volatility (IV) can provide insight into potential price movements. If IV is high, there could be a major event, like an earnings announcement or economic data release, that may drive significant volatility. If IV is low, you might want to look for stable price action and consider strategies like writing options.
Liquidity Management
High-volume contracts with a narrow bid-ask spread ensure you can enter and exit positions with minimal slippage. Pay attention to these factors to optimize your trades.
Conclusion 🎯
An option chain is a visual display of all key information a trader needs to trade in options. Think of it as a visual display of all available call and put contracts of a security. Knowing how to read an option chain is essential for making informed trading decisions for an option trader. By analyzing the various strike prices and data points, traders can compare different options and choose the ones that best fit their strategies.
